Web development is a challenging endeavour, and this challenge is only increasing as the web matures. What might have been considered a passable website ten years ago would seem starkly outdated to the user of today, and modern businesses are diverting more and more resources towards their online presence.
The complexity of both front-end and back-end web development has risen to meet these standards, and the software writers of today are responsible for managing this complexity. And although various frameworks and tools have emerged to make this process easier, much of this cognitive load still falls squarely on developers.
Building features that meet requirements and work without bugs isn’t easy, and as such programs need to be iteratively debugged before deployment. Debugging is absolutely critical here, and often consumes much more time than developers like to admit. For these reasons, approaching the act of debugging strategically can have a remarkable impact on programmer productivity.
As a modern developer who is involved in several layers of the application stack, it’s interesting to observe that not all of these layers are equally easy to debug. The refinement of in-browser development tools (with a prime example being Chrome’s dev tools) has played a key role in making the client side components of an application debuggable.
The DOM itself can be inspected elegantly, CSS styles can be monitored and tweaked in real time, and breakpoints can be inserted into client running scripts without trouble. Popular Javascript libraries such as React and Vue offer browser extensions perfectly tailored to the infrastructure of their framework. The Javascript console itself is attractive, feature rich, and an indispensable resource to developers.

All of this is to say that debugging can be done fairly well on the client side of a web application. But of course, this isn’t the full picture. The behaviour of server side services such as your web server, database management system, and programming language are more than likely going to require debugging at some point as well.
Naming names, PHP scripts are especially frustrating to debug. With many of the features of the browser’s developer tools unavailable, identifying and fixing bugs can be tedious at best. The remainder of this post focuses on some of the various tools and strategies available for this task.
The Example
To compare the pros and cons of these strategies in a concrete way, let’s look at an example. In this use case, our script has access to an array that contains information about various students who attend Springfield Elementary:
$students = [
    [
        'name' => 'Millhouse',
        'grade' => 60,
    ],
    [
        'name' => 'Lisa',
        'grade' => 95,
    ],
    [
        'name' => 'Bart',
        'grade' => 35,
    ],
];
Consider a scenario in which it becomes desirable to filter this list of students based on their grade. One way to achieve this would be by using PHP’s built in array_filter function:
$grade_threshold = 50;

$passing_students = array_filter($students, function($student) {
    return $student['grade'] >= $grade_threshold;
});

?>
<h3>Passing Students</h3>
<ul>
    <?php foreach ($passing_students as $student): ?>
        <li>
            <?= $student['name'] ?> - <?= $student['grade'] ?>%
        </li>
    <?php endforeach; ?>
</ul>
However, this script does not perform as expected. A notice titled Undefined variable: grade_threshold is generated on each iteration, and Bart (who has a grade of 35) appears in the outputted list. Clearly, something is wrong here.
Classic Debugging
The most basic way to debug PHP is by simply printing values that you suspect to be working incorrectly. Built in functions such as echo, print_r, and var_dump can be used to do this.
echois designed to print text (either plain or HTML) and will convert all values to strings. This coercion often results in values being outputted in unexpected ways (for example, values of null and false appear as an empty string, and an array with appear as the literal string “Array”).print_ris essentially a recursiveecho. Although this function allows for arrays and objects to be visualized, it still fails to communicate types.var_dumpworks likeprint_rbut also contains information about the value’s type. For this reason,var_dumpis often a better tool for debugging thanechoorprint_r.
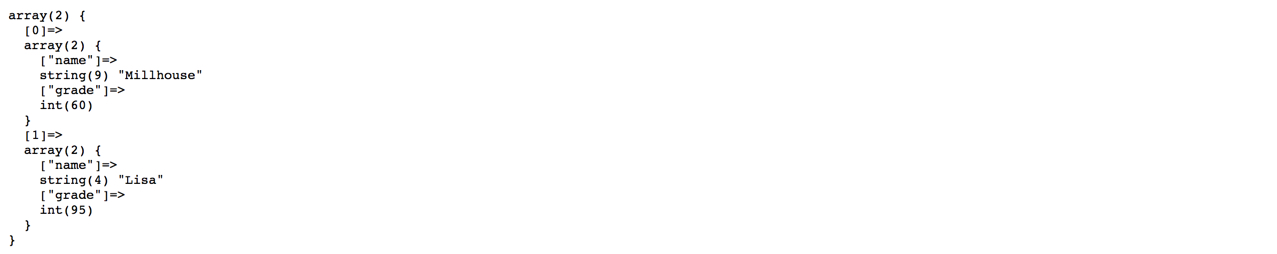
Applying this knowledge to our example, one might elect to execute a var_dump on the $grade_threshold from within the array_filter callback, and then execute another var_dump on $passing_students once the filtering has completed:
$passing_students = array_filter($students, function($student) {
    var_dump($grade_threshold);
    return $student['grade'] >= $grade_threshold;
});

var_dump($passing_students);
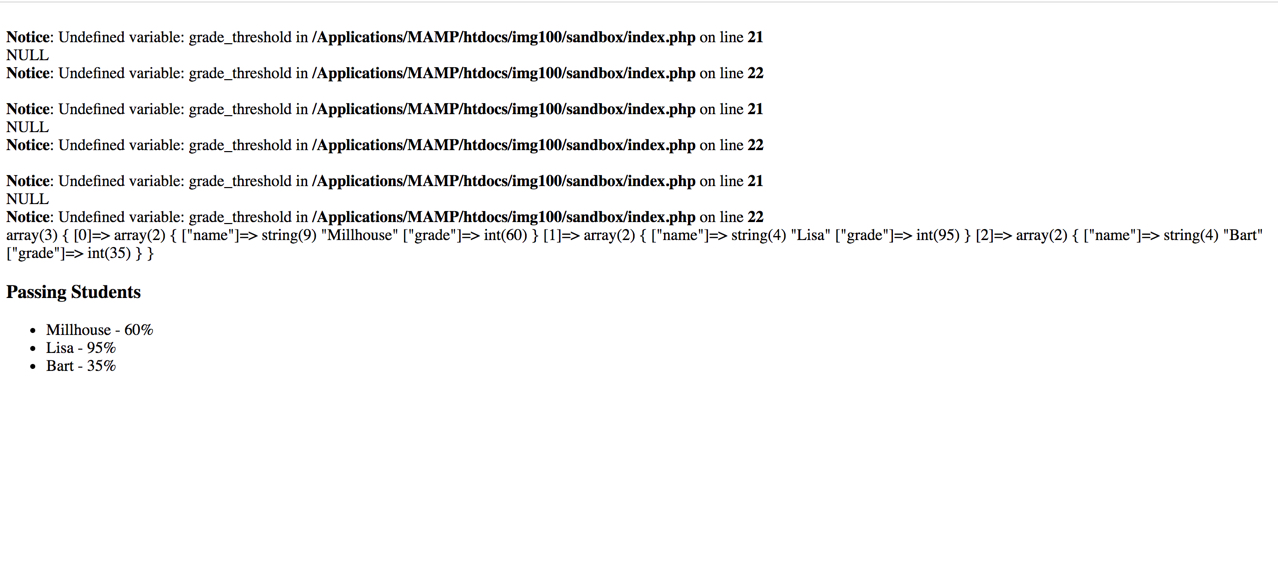
Based on the output above, it’s clear that the $grade_threshold variable does not exist within the loop, and that Bart is indeed passing the filter test. At this point a PHP dev might recall that callback functions do not have access to external variables (unlike Javascript or Python). This can be fixed by explicitly granting the callback access to the variable via the use keyword:
$passing_students = array_filter($students, function($student) use ($grade_threshold) {
    return $student['grade'] >= $grade_threshold;
});
Once this change is made, Bart will be stop appearing in our output and our script will perform correctly. Bug fixed!
In this situation, classic debugging techniques are sufficient to find our bug, but real world codebases often present additional roadblocks. For starters, unformatted print_r and var_dumps of large arrays and objects are ugly and hard to read, so debug data is often wrapped in pre tags to clean things up a bit. Utility functions that “dump and die” can be written to handle this:
function dd($data) {
    echo '<pre>';
    var_dump($data);
    echo '</pre>';
    die();
}
But even after writing a dedicated debugging function, things often continue to be messy. Web applications typically involve several stylesheets and scripts designed to produce a specific layout, and that layout may not be visually compatible with your debugging data. Unfortunately, the front end output and development debugging info are now competing for the same real estate (your browser window), and this is a major problem with classic PHP debugging.
Clever Workarounds
As mentioned earlier, the javascript console can be used to display data in a structured and inspectable form. Although some PHP data types (such as associative arrays) cannot be converted to Javascript, it is possible to encode data in JSON form and send it to the javascript console to be presented:
function console_log($data) {
    ?>
        <script>
            console.log(<?= json_encode($data) ?>)
        </script>
    <?php
}
But although this solution solves many of the formatting challenges outlined above, it can also create confusion. Once again, PHP errors are being sent to display in a location that is normally reserved for a different purpose.
Error Logs
PHP can be configured to log errors to a server side file, and most production servers elect for this approach for the purpose of security and professionalism. It’s also possible to write directly to this file by way of the built in error_log function. This technique finally moves our debugging data off the client, but suffers from the same shortcomings in formatting and modularity as previous methods.
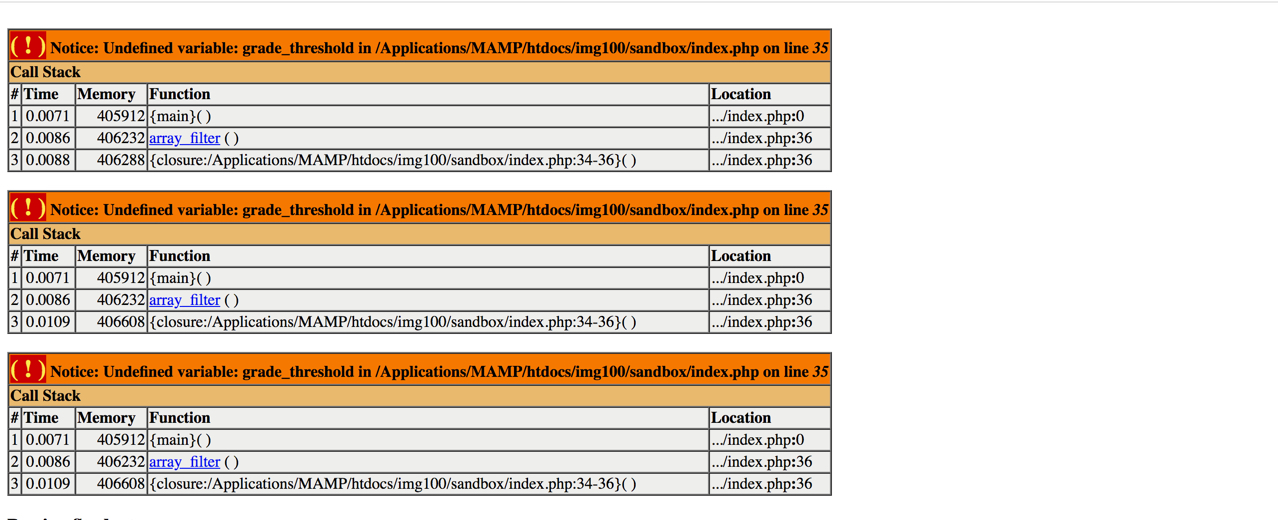
Xdebug
PHP can be debugged more easily with the help of Xdebug (https://xdebug.org). Upon installation, error messages and var_dumps are immediately improved:
Step by step debugging with break points also becomes possible with Xdebug, and VS Code offers a great free extension called PHP Debug (https://marketplace.visualstudio.com/items?itemName=felixfbecker.php-debug) that integrates with this seamlessly. Once configured, Xdebug runs locally on an independent port (Port 9000 by default), and VS Code can be triggered to listen to its output and pause at preset breakpoints (much like what Chrome dev tools offers for Javascript)
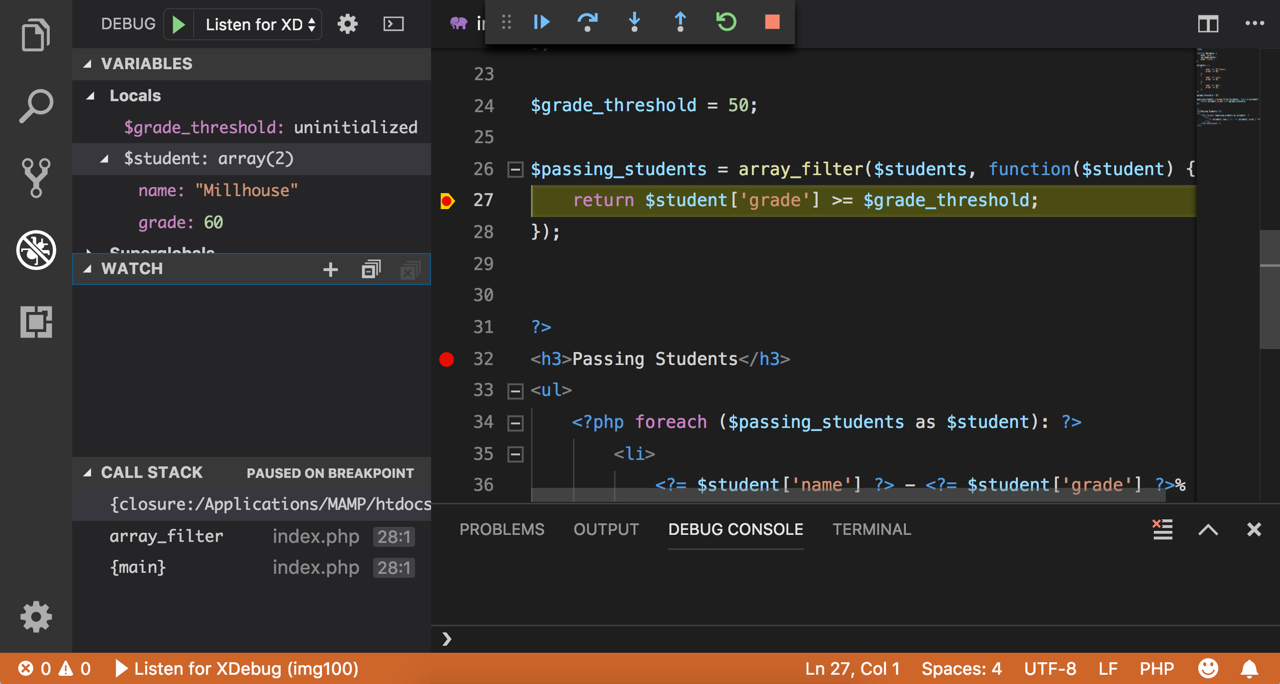
This solution finally provides a dedicated window for tracking variables and error/warning messages. The program’s execution can be paused and resumed at will, and breakpoints can be added and revised with ease. No lines of code need to be added to the script for the purpose of debugging, and nested values like arrays and objects can be collapsed and expanded.
Coming back to our example, adding a breakpoint inside the callback function allows for us to see the $grade_threshold variable as apparently uninitialized, which grants insight on the underlying scope problem causing the bug. All in all, Xdebug coupled with VS Code offers a level of professionalism and polish lacking in classic debug methods.
Installation and Setup
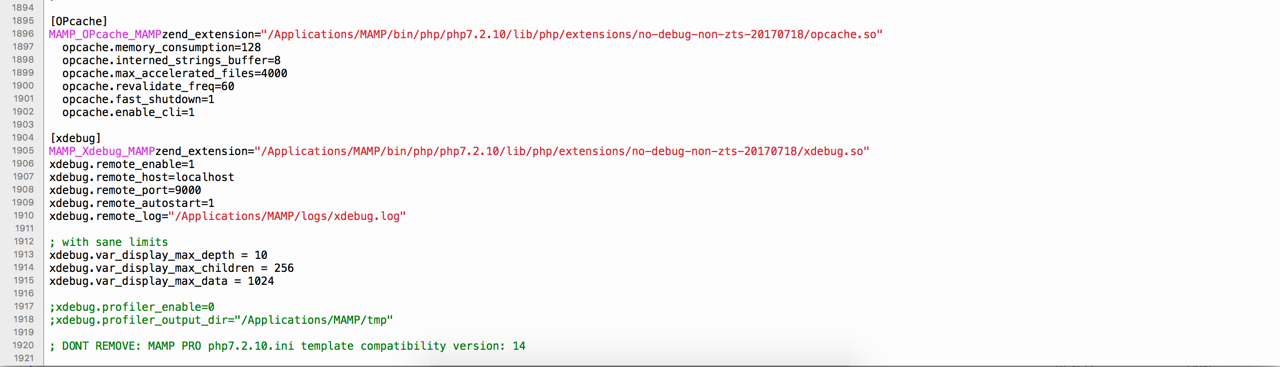
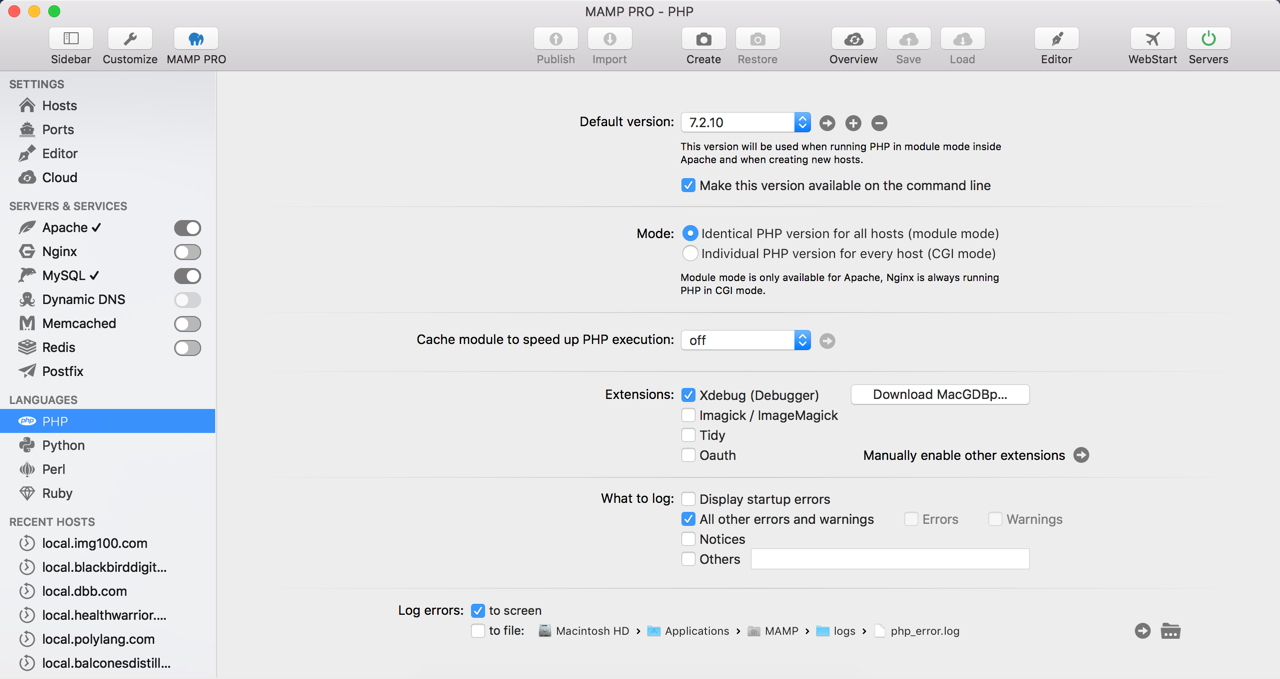
Xdebug works especially easily with MAMP PRO (my platform of choice for most PHP projects). In this case, the extension comes preinstalled and turning it on is as easy as clicking a checkbox and restarting the server. Installation of the VS Code package was similarly easy in my case.
Although things largely worked out of the box, I found that I had to adjust my php.ini file to ensure that large nested arrays and objects were fully available from VS Code’s variables panel.